Today, businesses create large amounts of data from sales, marketing, customer service, finance, and website activity. But raw data alone does not help. Companies need a simple way to understand what the numbers mean. A Business Intelligence Dashboard helps businesses turn complex data into clear visual reports so they can make better and faster decisions.
What Is a Business Intelligence Dashboard?
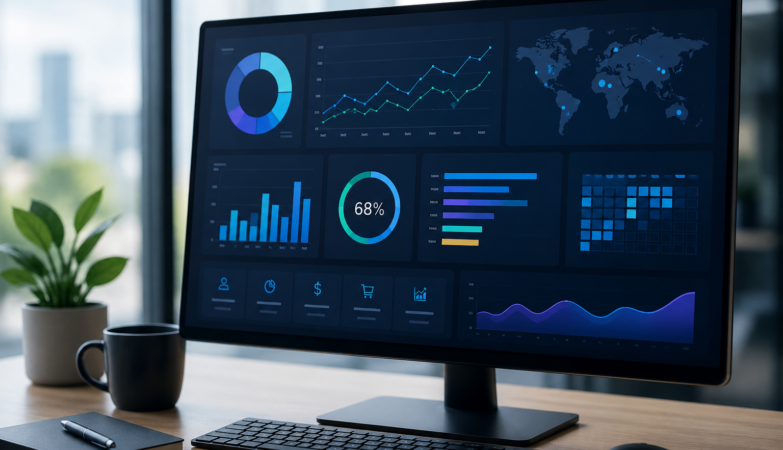
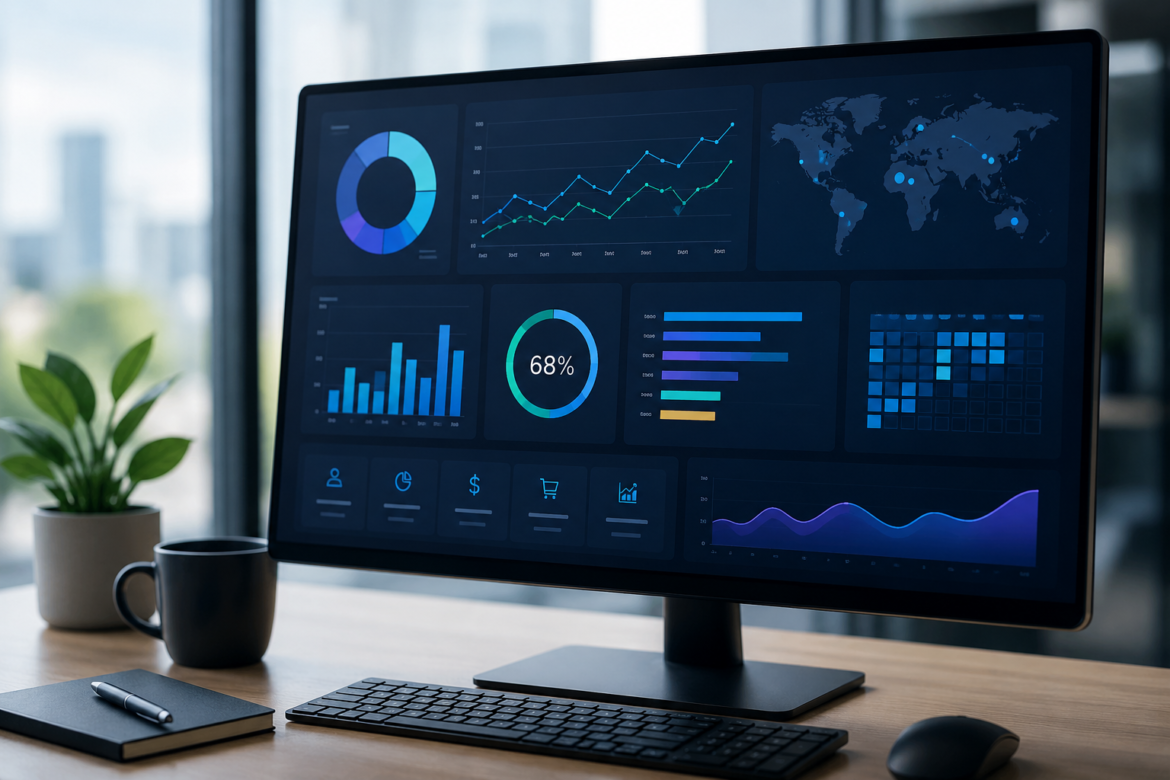
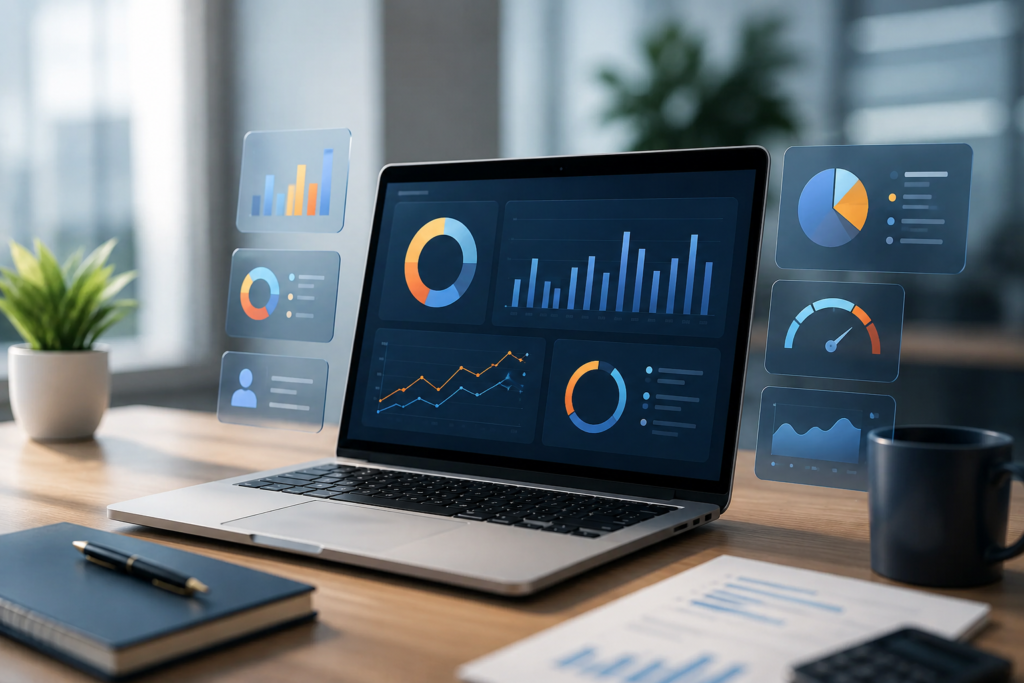
A Business Intelligence Dashboard is a visual tool that shows important business data in one place. It uses charts, graphs, tables, and KPI metrics to display performance in a simple format.
Instead of reading long spreadsheets, managers can quickly see what is happening inside the company. This makes it easier to find problems, opportunities, and trends. The dashboard usually collects data from multiple systems such as CRM software, ERP tools, databases, and cloud applications.
Why Real-Time Data Matters
Modern businesses move fast. Customer needs change quickly, and market trends can shift overnight. If a company waits days or weeks for reports, it may miss important opportunities.
Real-time data helps teams react immediately. For example, if online sales suddenly drop, the business can investigate the issue before losses grow. This is why live reporting has become very important for modern companies.
How a Business Intelligence Dashboard Improves Decision-Making
A Business Intelligence Dashboard helps leaders make decisions based on facts instead of guesses. When decision-makers see accurate data, they can plan with more confidence.
For example, managers can easily answer important questions like:
- Which product sells the most?
- Which marketing campaign brings more leads?
- Where are costs increasing?
- Which area needs improvement?
This reduces business risk and improves strategic planning.
Key Features of a Strong BI Dashboard
A good dashboard offers many useful features. One major feature is KPI tracking. KPI stands for Key Performance Indicator, which measures business success.
Examples include:
- Revenue growth
- Customer retention
- Profit margin
- Conversion rate
- Customer satisfaction
Another important feature is interactive reporting. Users can filter data, compare time periods, and explore detailed reports. This makes analysis deeper and more useful.
Major Benefits for Modern Businesses
One major benefit is better productivity. Many companies still spend hours making manual reports. Dashboards automate this process and save valuable time.
Another benefit is better communication. When all teams look at the same data, everyone understands business performance clearly. This reduces confusion and improves teamwork.
A Business Intelligence Dashboard also improves forecasting. Businesses can use past and current data to predict future trends. This helps companies prepare for growth, demand changes, and risks.
Common Business Problems BI Dashboards Solve
Many businesses struggle with scattered data. Information may be stored in multiple tools, spreadsheets, or departments. This makes reporting slow and confusing.
A dashboard solves this by creating a single source of truth. All important data becomes available in one place. This improves clarity and reduces reporting mistakes.
Another common problem is delayed reporting. Old reports may not show current conditions. With automated dashboards, businesses always see updated information.
Industries That Use BI Dashboards
Almost every industry benefits from dashboard technology. In retail, dashboards track inventory, sales, and customer behavior.
In healthcare, dashboards help hospitals monitor patient care, treatment performance, and operational efficiency. In finance, they help track costs, revenue, cash flow, and fraud risks.
Manufacturing companies use dashboards to monitor machine performance, production speed, and supply chain health. E-commerce businesses use them to track orders, traffic, and conversion rates.
Popular Business Intelligence Tools
Many software companies offer advanced BI solutions. Popular tools include Microsoft Power BI, Tableau, Looker Studio, Qlik Sense, and SAP Analytics Cloud.
These tools help companies connect multiple data sources and build visual dashboards. Some tools are better for small businesses, while others are designed for large enterprises.
Challenges Businesses Should Consider
BI dashboards are powerful, but they also have challenges. One challenge is poor data quality. If the input data is wrong, the dashboard results will also be wrong.
Another challenge is system integration. Some companies use many old systems, and connecting them can be difficult. Businesses must also think about data security because dashboards often contain sensitive information.
Training employees is also important. A tool only creates value when people know how to use it properly.
Future of Business Intelligence Dashboards
The future of dashboards looks exciting. New technologies like Artificial Intelligence (AI) and Machine Learning (ML) are changing how dashboards work.
AI can automatically detect patterns and unusual changes in data. Machine learning can improve predictions and forecasting. Soon, more dashboards will support natural language queries.
For example, a user may simply ask: “Show me sales growth in March,” and the dashboard will provide the answer instantly. This will make analytics easier for everyone.
Why Businesses Cannot Ignore BI Dashboards
Today’s business world is highly competitive. Companies that understand data faster often perform better than competitors. A Business Intelligence Dashboard gives businesses speed, clarity, and confidence.
It helps companies improve decisions, reduce risks, increase productivity, and grow revenue. In a world driven by data, businesses that use dashboards effectively gain a strong advantage.
That is why a Business Intelligence Dashboard is no longer optional—it is becoming essential for modern business success.
Frequently Asked Questions (FAQs)
What is a Business Intelligence Dashboard?
It is a visual dashboard that shows business data using charts, graphs, and reports.
Why do businesses use BI dashboards?
Businesses use them to make faster and smarter decisions using real-time data.
Which industries use BI dashboards?
Retail, healthcare, finance, manufacturing, and e-commerce commonly use them.
What tools are used for BI dashboards?
Popular tools include Microsoft Power BI and Tableau.
Can small businesses use BI dashboards?
Yes, small businesses can use dashboards to improve reporting and growth planning.